Category Archives: Research

Region Specific Books on NovelRank

I just thought this was really interesting, so I’m sharing it. In an effort to continue to make NovelRank not only an efficient tool, but also allow it to continue to grow, I had to look at some interesting statistics.

Below is a list of Amazon domains that NovelRank tracks, followed by the number of books that are listed EXCLUSIVELY on that domain (for instance, if the book is on Amazon.com AND Amazon.co.uk it is not counted).

  • 17824 unique books on Amazon.com
  • 3234 unique books on Amazon.de
  • 1317 unique books on Amazon.co.uk
  • 186 unique books on Amazon.fr
  • 74 unique books on Amazon.ca
  • 18 unique books on Amazon.co.jp

Now, with Kindle books being exclusive to Amazon.com for so long, and Amazon.com being the biggest of all the domains, the biggest number is no surprise. However, Amazon.de is a fantastic surprise. I’ve known there to be many visitors recently, but this really put the point on it. If you have any feedback about how NovelRank can better serve a German audience, please let me know in the comments below.

Book Sales Rankings

Pursuit of Honor book cover
I was recently asked what amount of book sales lead to rankings averaging 100, 1000, etc. Put another way, how many books would an author have to sell in a given month to have an average ranking for the month of 1000? So, I dug back into the book sales estimates and came up with 3 examples.

This is based on data on Amazon.com only. For Amazon.co.uk, you can roughly estimate that it takes only 80% of the number of sales on Amazon.com to equate to the same average ranking. For Canada, Germany, Japan, and France, it is approximately 65%, though there is not enough data in NovelRank to depend on that percentage.

Sales Rank Average: 1000 (paperback, hardcover, etc)

Example book: Pursuit of Honor by Vince Flynn
About 250 copies were sold to maintain a sales rank around 1000. That makes it 8 books per day, with a sale occurring every 3 hours, or maybe 2 books selling every 6 hours! Either way, this is a very healthy sales rank.

Sales Rank Average: 100 (paperback, hardcover, etc)

Example book: The Elegance of the Hedgehog by Muriel Barbery and Alison Anderson
Almost 2000 copies were sold in May to garner an average sales rank of 106. That is a selling rate of at least 3 books per hour! What is likely is that this number may actually be notably higher, as sales rank changes are less defined or varied at this level, however it is hard to verify.

Sales Rank Average: 2000 (Kindle Edition books)

Example book: In the Mood by Ellen Fisher
Selling approximately 500 kindle books a month will lead to an average sales rank around 2000 for your book. To do this, you need to sell about 16 books a day or 1 book every 90 minutes.

Note: This Kindle sales estimate is based upon real sales data from Amazon DTP provided to me from the author. NovelRank is currently underestimating for Kindle Edition books with a Sales Rank below 4000.

Hopefully this is enlightening for you. Remember, the strength of NovelRank is not in raw numbers; You will get those from your publisher eventually, but rather in understanding the fluctuations so you can attribute your best marketing efforts to the strongest sales bumps in near real-time.

Disclaimer: NovelRank book sales estimates are based on fluctuations of sales rank and thus there are many factors (another blog post coming soon) that can cause for more sales to occur than is estimated by NovelRank. These numbers are estimates.

Lulu.com Books on Amazon: 6 Month Analysis of Sales Rank

The following research is based upon a source of 506 Lulu.com published books. The books were selected based upon Amazon presenting over 1000 books ranked by their current Sales Rank on May 23, 2009. This list was then reordered for the top 500 books at that moment in time. Since then, 6 additional Lulu.com books were independently added for a total of 506 books. It’s also important to note that every book must have sold at least 1 copy on Amazon to be given a Sales Rank. This is an analysis of the 6 months of data from June 2009 through November 2009.

Statistics: Lulu.com Published Books on Amazon.com

On Average, a sale occurs every 4 days for a Lulu.com book.

Be aware that these statistics are only for Amazon.com, not for sales that occur on Lulu.com, which most authors would prefer due to higher author revenue (241% in my book’s case). That sales data however is locked to only the author’s account, and while Lulu offers sales rank information, it falls into the same category as Barnes & Noble in usefulness: not updated frequently enough and not accessible enough to allow for tracking by NovelRank.

If you are a Lulu author who used the Published by Lulu.com option when purchasing/given your ISBN and your book is found on Amazon, chances are that your book already exists in the NovelRank database. Grab your Amazon.com link and enter it into Search for your book on the Sales Rank Tracking page (updated January 24, 2010). Alternatively, you can see a list of all tracked books with Lulu.com as the publisher.

Book Sales Data Breakdown – Days and Hours

I’ve been looking forward to this post for a while, so I’m excited to release it as a New Year’s gift for 2010. I’m going to provide a quick breakdown with charts of book sales data with consideration to three criteria:

The following data encompasses information collected from June ’09 through Dec ’09. There was no consideration for newly added books (daily occurrence) as over a long enough period this should provide some balance. There also is no consideration for books with sales ranks trends, which is the focus of this study.

Finally, this only includes Amazon.com and Amazon.co.uk as these domains have the most activity as well as the longest history within NovelRank. Now, without further adieu…

Book Sales Data by Days of the Month

I love graphs. I don’t think there is much to say for this category, so let’s start with the charts:
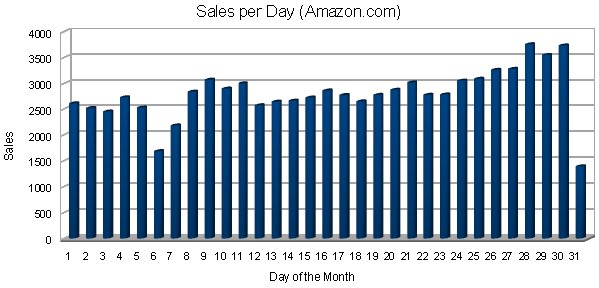
Sales Per Day of the Month - Amazon.com
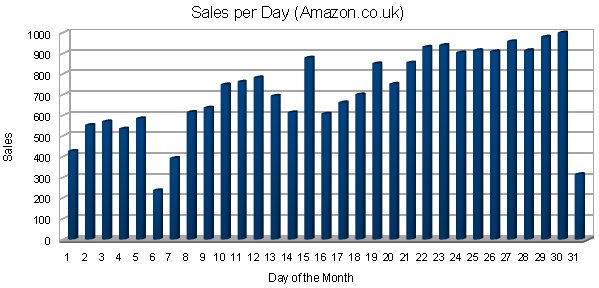
Sales Per Day of the Month - Amazon.co.uk

This data was collected near the end of December and to ensure it was not too heavily skewed, it was limited to June through November ’09. What I think is completely shocking is that nobody likes the 6th of the month. In the UK, the middle of the month is hot, but overall both charts show a trend towards the end of the month for shopping for books.

Book Sales Data by Days of the Week
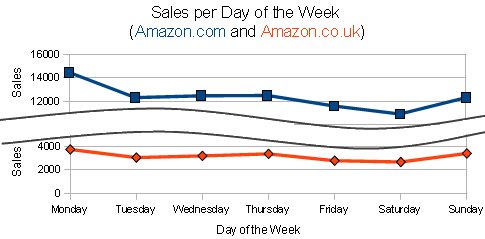
Sales Per Day of the Week - Amazon.com & Amazon.co.uk

This chart was altered slightly as the numbers were almost 4 times higher for sales on Amazon.com over Amazon.co.uk, but only to allow a closer comparison between both of the line graphs. While the UK line is smoother due to the lower volume, the overall trending is the same. Monday is the largest shopping day for books, followed by another spike on Thursday. Completely surprising to me is that Saturday’s are not a day to go shopping for books!

Book Sales Data by Hours of the Day

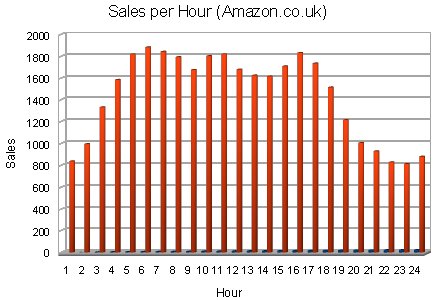
One quick note about the times. The times are in PST for both Amazon.com and Amazon.co.uk. Thus, there is an -8 hour shift for UK times. Thus, 00 for Amazon.com is 16 for Amazon.co.uk (midnight in both locations) while 12 for Amazon.com is 04 for Amazon.co.uk (noon in both locations). This is a poor oversight on my part to not correct for this in the graphing directly.
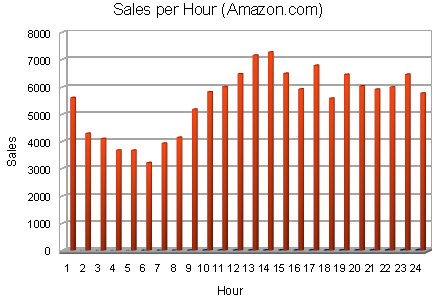
Book Sales Data per Hour - Amazon.com
Book Sales Data per Hour - Amazon.co.uk

The buying cycle is very different for both sites/location. Granted, there maybe some error based upon Amazon’s failure to update sales rank data every single hour sometimes, notably for Amazon.com. This is a limitation of being dependent on Amazon’s updates to actually accumulate the data. However, I have not compiled (because I’m not collecting it in a way that is easy to analyze, yet) an outage log for each domain. I will begin tracking that information in 2010 and come back with more results in Q3 of 2010.

Final Thoughts

I’d like to approach this data again with a bit more scrutiny in 2010 and include the graphs I mentioned previously. I would definitely appreciate feedback in the comments below regarding the data itself and considerations for making the data more useful or accurate (I’m not a statistician). However, I can say that your book marketing efforts are best spent Sunday night or Monday morning near the end of the month to maximize book sales potential. Without the numbers to back it up (just an observation), if you sell less than 24 books a month, you will notice that a sale grants greater weight and exposure to your book (thanks to category rankings on Amazon) and typically lead to more sales in clusters. I hope to gather some data regarding number of sales after X number of days without a sale to back this up, but that requires a lot of data analysis which will have to wait till Q3 2010.

Thanks in advance, and I hope this proves at the very least interesting! Consider supporting NovelRank by tracking your book and sharing it with your friends!