I’ve slowly added a new feature to the book details page: analysis (circled in red).
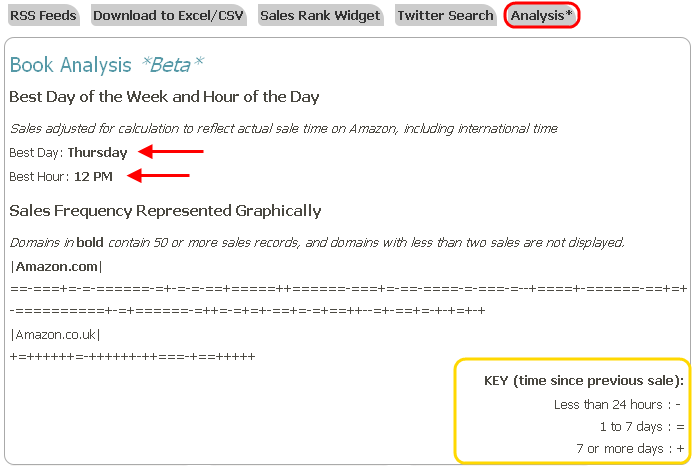
As seen in the example above, the book analysis includes three items:
- Best day of the week for sales to occur
- Best hour of the day (or best 2 hours in case of a tie) for sales to occur
- Breakdown of sales frequency
The first two items (marked with two red arrows) take into account two additional timezone aware facts: Sales occur 3 hours prior to the change in sales rank and the sale time should be adjusted for worldwide domain timezones, including GMT (United Kingdom), CET (Germany and France), and JST (Japan). Thus, you get a true indication, worldwide, of when your book is most popular in regards to days of the week and hours of the day.
The last item is a basic graphical example of sales frequency: How soon after the last sale does the next sale occur. This is represented with different symbols, described in the Key in the bottom-right (highlighted in yellow).
The analysis tab is the result of 4 hours I spent trying to aggregate this information across books that sell at different levels of frequency and develop some deeper sales analysis that takes the full breadth of books on NovelRank and provides some insight. Unfortunately, the results were not significant. Thus, the new tab was born to provide you information about individual books. In other words, I turned lemons into lemonade.
Note: Amazon.com sales are based on PST, so there is a small 2 hour margin of error in the ‘best X’ estimates.